551 lines
20 KiB
Markdown
551 lines
20 KiB
Markdown
|
|
# swarmprom
|
|||
|
|
|
|||
|
|
Swarmprom is a starter kit for Docker Swarm monitoring with [Prometheus](https://prometheus.io/),
|
|||
|
|
[Grafana](http://grafana.org/),
|
|||
|
|
[cAdvisor](https://github.com/google/cadvisor),
|
|||
|
|
[Node Exporter](https://github.com/prometheus/node_exporter),
|
|||
|
|
[Alert Manager](https://github.com/prometheus/alertmanager)
|
|||
|
|
and [Unsee](https://github.com/cloudflare/unsee).
|
|||
|
|
|
|||
|
|
## Install
|
|||
|
|
|
|||
|
|
Clone this repository and run the monitoring stack:
|
|||
|
|
|
|||
|
|
```bash
|
|||
|
|
$ git clone https://github.com/stefanprodan/swarmprom.git
|
|||
|
|
$ cd swarmprom
|
|||
|
|
|
|||
|
|
ADMIN_USER=admin \
|
|||
|
|
ADMIN_PASSWORD=admin \
|
|||
|
|
SLACK_URL=https://hooks.slack.com/services/TOKEN \
|
|||
|
|
SLACK_CHANNEL=devops-alerts \
|
|||
|
|
SLACK_USER=alertmanager \
|
|||
|
|
docker stack deploy -c docker-compose.yml mon
|
|||
|
|
```
|
|||
|
|
|
|||
|
|
Prerequisites:
|
|||
|
|
|
|||
|
|
* Docker CE 17.09.0-ce or Docker EE 17.06.2-ee-3
|
|||
|
|
* Swarm cluster with one manager and a worker node
|
|||
|
|
* Docker engine experimental enabled and metrics address set to `0.0.0.0:9323`
|
|||
|
|
|
|||
|
|
Services:
|
|||
|
|
|
|||
|
|
* prometheus (metrics database) `http://<swarm-ip>:9090`
|
|||
|
|
* grafana (visualize metrics) `http://<swarm-ip>:3000`
|
|||
|
|
* node-exporter (host metrics collector)
|
|||
|
|
* cadvisor (containers metrics collector)
|
|||
|
|
* dockerd-exporter (Docker daemon metrics collector, requires Docker experimental metrics-addr to be enabled)
|
|||
|
|
* alertmanager (alerts dispatcher) `http://<swarm-ip>:9093`
|
|||
|
|
* unsee (alert manager dashboard) `http://<swarm-ip>:9094`
|
|||
|
|
* caddy (reverse proxy and basic auth provider for prometheus, alertmanager and unsee)
|
|||
|
|
|
|||
|
|
|
|||
|
|
## Alternative install with Traefik and HTTPS
|
|||
|
|
|
|||
|
|
If you have a Docker Swarm cluster with a global Traefik set up as described in [DockerSwarm.rocks](https://dockerswarm.rocks), you can deploy Swarmprom integrated with that global Traefik proxy.
|
|||
|
|
|
|||
|
|
This way, each Swarmprom service will have its own domain, and each of them will be served using HTTPS, with certificates generated (and renewed) automatically.
|
|||
|
|
|
|||
|
|
### Requisites
|
|||
|
|
|
|||
|
|
These instructions assume you already have Traefik set up following that guide above, in short:
|
|||
|
|
|
|||
|
|
* With automatic HTTPS certificate generation.
|
|||
|
|
* A Docker Swarm network `traefik-public`.
|
|||
|
|
* Filtering to only serve containers with a label `traefik.constraint-label=traefik-public`.
|
|||
|
|
|
|||
|
|
### Instructions
|
|||
|
|
|
|||
|
|
* Clone this repository and enter into the directory:
|
|||
|
|
|
|||
|
|
```bash
|
|||
|
|
$ git clone https://github.com/stefanprodan/swarmprom.git
|
|||
|
|
$ cd swarmprom
|
|||
|
|
```
|
|||
|
|
|
|||
|
|
* Set and export an `ADMIN_USER` environment variable:
|
|||
|
|
|
|||
|
|
```bash
|
|||
|
|
export ADMIN_USER=admin
|
|||
|
|
```
|
|||
|
|
|
|||
|
|
* Set and export an `ADMIN_PASSWORD` environment variable:
|
|||
|
|
|
|||
|
|
|
|||
|
|
```bash
|
|||
|
|
export ADMIN_PASSWORD=changethis
|
|||
|
|
```
|
|||
|
|
|
|||
|
|
* Set and export a hashed version of the `ADMIN_PASSWORD` using `openssl`, it will be used by Traefik's HTTP Basic Auth for most of the services:
|
|||
|
|
|
|||
|
|
```bash
|
|||
|
|
export HASHED_PASSWORD=$(openssl passwd -apr1 $ADMIN_PASSWORD)
|
|||
|
|
```
|
|||
|
|
|
|||
|
|
* You can check the contents with:
|
|||
|
|
|
|||
|
|
```bash
|
|||
|
|
echo $HASHED_PASSWORD
|
|||
|
|
```
|
|||
|
|
|
|||
|
|
it will look like:
|
|||
|
|
|
|||
|
|
```
|
|||
|
|
$apr1$89eqM5Ro$CxaFELthUKV21DpI3UTQO.
|
|||
|
|
```
|
|||
|
|
|
|||
|
|
* Create and export an environment variable `DOMAIN`, e.g.:
|
|||
|
|
|
|||
|
|
```bash
|
|||
|
|
export DOMAIN=example.com
|
|||
|
|
```
|
|||
|
|
|
|||
|
|
and make sure that the following sub-domains point to your Docker Swarm cluster IPs:
|
|||
|
|
|
|||
|
|
* `grafana.example.com`
|
|||
|
|
* `alertmanager.example.com`
|
|||
|
|
* `unsee.example.com`
|
|||
|
|
* `prometheus.example.com`
|
|||
|
|
|
|||
|
|
(and replace `example.com` with your actual domain).
|
|||
|
|
|
|||
|
|
**Note**: You can also use a subdomain, like `swarmprom.example.com`. Just make sure that the subdomains point to (at least one of) your cluster IPs. Or set up a wildcard subdomain (`*`).
|
|||
|
|
|
|||
|
|
* If you are using Slack and want to integrate it, set the following environment variables:
|
|||
|
|
|
|||
|
|
```bash
|
|||
|
|
export SLACK_URL=https://hooks.slack.com/services/TOKEN
|
|||
|
|
export SLACK_CHANNEL=devops-alerts
|
|||
|
|
export SLACK_USER=alertmanager
|
|||
|
|
```
|
|||
|
|
|
|||
|
|
**Note**: by using `export` when declaring all the environment variables above, the next command will be able to use them.
|
|||
|
|
|
|||
|
|
* Deploy the Traefik version of the stack:
|
|||
|
|
|
|||
|
|
|
|||
|
|
```bash
|
|||
|
|
docker stack deploy -c docker-compose.traefik.yml swarmprom
|
|||
|
|
```
|
|||
|
|
|
|||
|
|
To test it, go to each URL:
|
|||
|
|
|
|||
|
|
* `https://grafana.example.com`
|
|||
|
|
* `https://alertmanager.example.com`
|
|||
|
|
* `https://unsee.example.com`
|
|||
|
|
* `https://prometheus.example.com`
|
|||
|
|
|
|||
|
|
|
|||
|
|
## Setup Grafana
|
|||
|
|
|
|||
|
|
Navigate to `http://<swarm-ip>:3000` and login with user ***admin*** password ***admin***.
|
|||
|
|
You can change the credentials in the compose file or
|
|||
|
|
by supplying the `ADMIN_USER` and `ADMIN_PASSWORD` environment variables at stack deploy.
|
|||
|
|
|
|||
|
|
Swarmprom Grafana is preconfigured with two dashboards and Prometheus as the default data source:
|
|||
|
|
|
|||
|
|
* Name: Prometheus
|
|||
|
|
* Type: Prometheus
|
|||
|
|
* Url: http://prometheus:9090
|
|||
|
|
* Access: proxy
|
|||
|
|
|
|||
|
|
After you login, click on the home drop down, in the left upper corner and you'll see the dashboards there.
|
|||
|
|
|
|||
|
|
***Docker Swarm Nodes Dashboard***
|
|||
|
|
|
|||
|
|

|
|||
|
|
|
|||
|
|
URL: `http://<swarm-ip>:3000/dashboard/db/docker-swarm-nodes`
|
|||
|
|
|
|||
|
|
This dashboard shows key metrics for monitoring the resource usage of your Swarm nodes and can be filtered by node ID:
|
|||
|
|
|
|||
|
|
* Cluster up-time, number of nodes, number of CPUs, CPU idle gauge
|
|||
|
|
* System load average graph, CPU usage graph by node
|
|||
|
|
* Total memory, available memory gouge, total disk space and available storage gouge
|
|||
|
|
* Memory usage graph by node (used and cached)
|
|||
|
|
* I/O usage graph (read and write Bps)
|
|||
|
|
* IOPS usage (read and write operation per second) and CPU IOWait
|
|||
|
|
* Running containers graph by Swarm service and node
|
|||
|
|
* Network usage graph (inbound Bps, outbound Bps)
|
|||
|
|
* Nodes list (instance, node ID, node name)
|
|||
|
|
|
|||
|
|
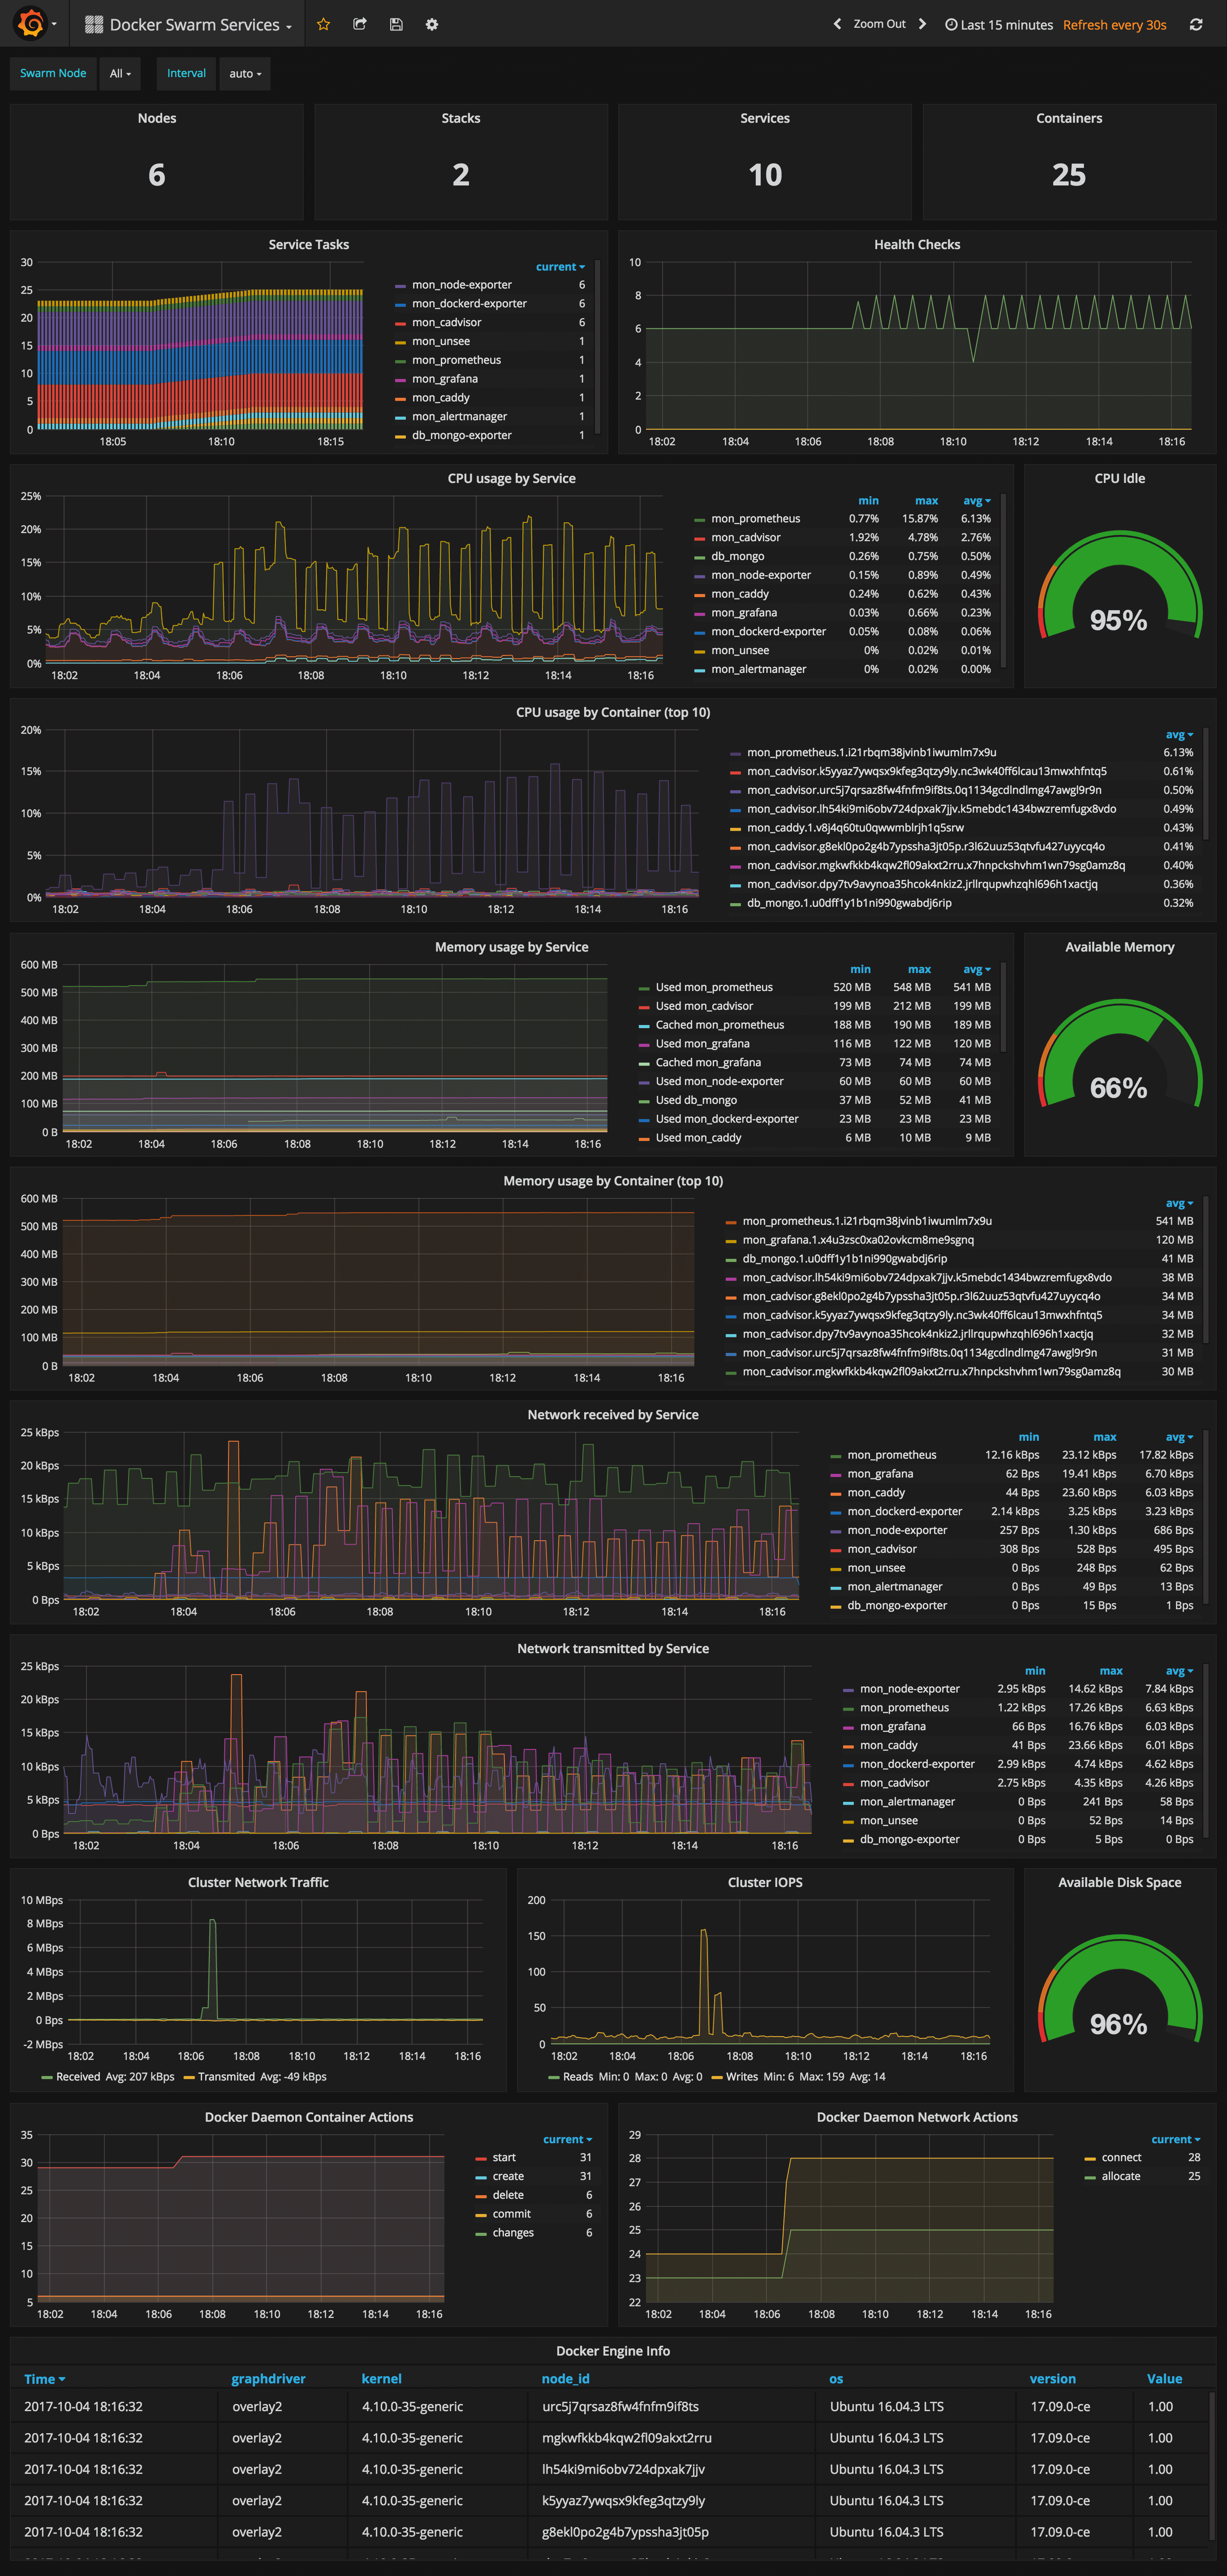
***Docker Swarm Services Dashboard***
|
|||
|
|
|
|||
|
|
|
|||
|
|
|
|||
|
|
URL: `http://<swarm-ip>:3000/dashboard/db/docker-swarm-services`
|
|||
|
|
|
|||
|
|
This dashboard shows key metrics for monitoring the resource usage of your Swarm stacks and services, can be filtered by node ID:
|
|||
|
|
|
|||
|
|
* Number of nodes, stacks, services and running container
|
|||
|
|
* Swarm tasks graph by service name
|
|||
|
|
* Health check graph (total health checks and failed checks)
|
|||
|
|
* CPU usage graph by service and by container (top 10)
|
|||
|
|
* Memory usage graph by service and by container (top 10)
|
|||
|
|
* Network usage graph by service (received and transmitted)
|
|||
|
|
* Cluster network traffic and IOPS graphs
|
|||
|
|
* Docker engine container and network actions by node
|
|||
|
|
* Docker engine list (version, node id, OS, kernel, graph driver)
|
|||
|
|
|
|||
|
|
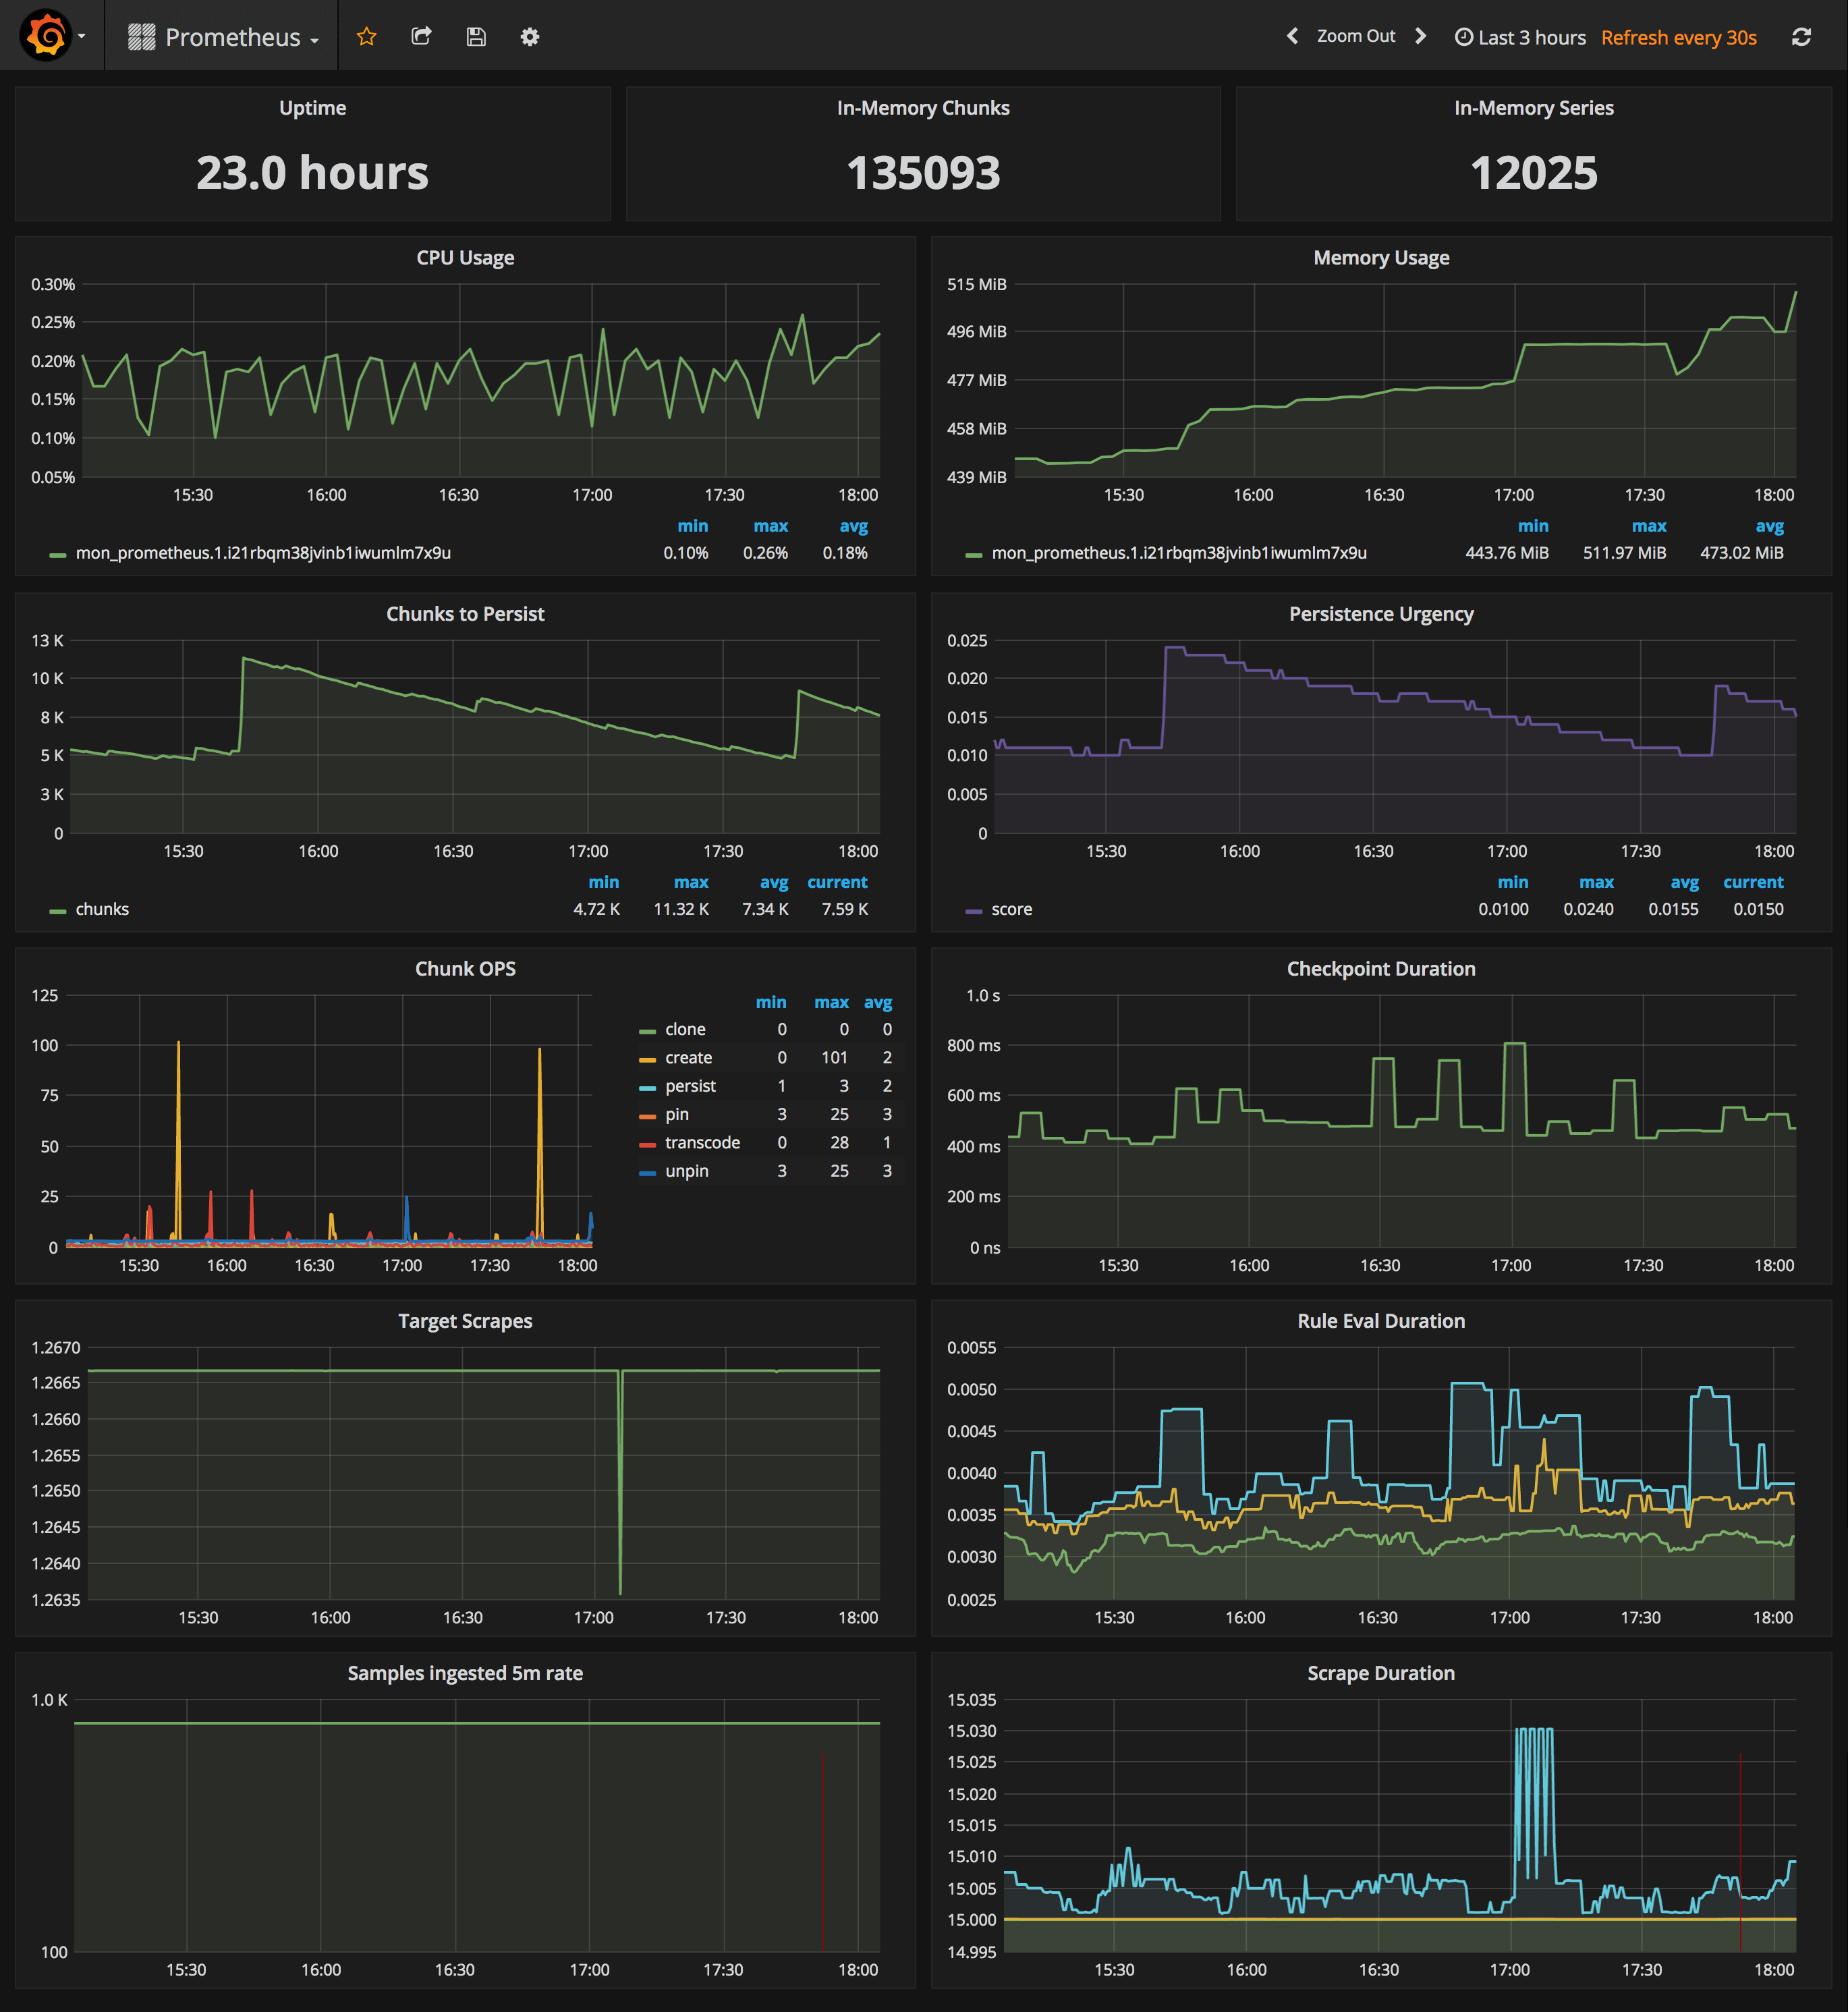
***Prometheus Stats Dashboard***
|
|||
|
|
|
|||
|
|
|
|||
|
|
|
|||
|
|
URL: `http://<swarm-ip>:3000/dashboard/db/prometheus`
|
|||
|
|
|
|||
|
|
* Uptime, local storage memory chunks and series
|
|||
|
|
* CPU usage graph
|
|||
|
|
* Memory usage graph
|
|||
|
|
* Chunks to persist and persistence urgency graphs
|
|||
|
|
* Chunks ops and checkpoint duration graphs
|
|||
|
|
* Target scrapes, rule evaluation duration, samples ingested rate and scrape duration graphs
|
|||
|
|
|
|||
|
|
|
|||
|
|
## Prometheus service discovery
|
|||
|
|
|
|||
|
|
In order to collect metrics from Swarm nodes you need to deploy the exporters on each server.
|
|||
|
|
Using global services you don't have to manually deploy the exporters. When you scale up your
|
|||
|
|
cluster, Swarm will launch a cAdvisor, node-exporter and dockerd-exporter instance on the newly created nodes.
|
|||
|
|
All you need is an automated way for Prometheus to reach these instances.
|
|||
|
|
|
|||
|
|
Running Prometheus on the same overlay network as the exporter services allows you to use the DNS service
|
|||
|
|
discovery. Using the exporters service name, you can configure DNS discovery:
|
|||
|
|
|
|||
|
|
```yaml
|
|||
|
|
scrape_configs:
|
|||
|
|
- job_name: 'node-exporter'
|
|||
|
|
dns_sd_configs:
|
|||
|
|
- names:
|
|||
|
|
- 'tasks.node-exporter'
|
|||
|
|
type: 'A'
|
|||
|
|
port: 9100
|
|||
|
|
- job_name: 'cadvisor'
|
|||
|
|
dns_sd_configs:
|
|||
|
|
- names:
|
|||
|
|
- 'tasks.cadvisor'
|
|||
|
|
type: 'A'
|
|||
|
|
port: 8080
|
|||
|
|
- job_name: 'dockerd-exporter'
|
|||
|
|
dns_sd_configs:
|
|||
|
|
- names:
|
|||
|
|
- 'tasks.dockerd-exporter'
|
|||
|
|
type: 'A'
|
|||
|
|
port: 9323
|
|||
|
|
```
|
|||
|
|
|
|||
|
|
When Prometheus runs the DNS lookup, Docker Swarm will return a list of IPs for each task.
|
|||
|
|
Using these IPs, Prometheus will bypass the Swarm load-balancer and will be able to scrape each exporter
|
|||
|
|
instance.
|
|||
|
|
|
|||
|
|
The problem with this approach is that you will not be able to tell which exporter runs on which node.
|
|||
|
|
Your Swarm nodes' real IPs are different from the exporters IPs since exporters IPs are dynamically
|
|||
|
|
assigned by Docker and are part of the overlay network.
|
|||
|
|
Swarm doesn't provide any records for the tasks DNS, besides the overlay IP.
|
|||
|
|
If Swarm provides SRV records with the nodes hostname or IP, you can re-label the source
|
|||
|
|
and overwrite the overlay IP with the real IP.
|
|||
|
|
|
|||
|
|
In order to tell which host a node-exporter instance is running, I had to create a prom file inside
|
|||
|
|
the node-exporter containing the hostname and the Docker Swarm node ID.
|
|||
|
|
|
|||
|
|
When a node-exporter container starts `node-meta.prom` is generated with the following content:
|
|||
|
|
|
|||
|
|
```bash
|
|||
|
|
"node_meta{node_id=\"$NODE_ID\", node_name=\"$NODE_NAME\"} 1"
|
|||
|
|
```
|
|||
|
|
|
|||
|
|
The node ID value is supplied via `{{.Node.ID}}` and the node name is extracted from the `/etc/hostname`
|
|||
|
|
file that is mounted inside the node-exporter container.
|
|||
|
|
|
|||
|
|
```yaml
|
|||
|
|
node-exporter:
|
|||
|
|
image: stefanprodan/swarmprom-node-exporter
|
|||
|
|
environment:
|
|||
|
|
- NODE_ID={{.Node.ID}}
|
|||
|
|
volumes:
|
|||
|
|
- /etc/hostname:/etc/nodename
|
|||
|
|
command:
|
|||
|
|
- '-collector.textfile.directory=/etc/node-exporter/'
|
|||
|
|
```
|
|||
|
|
|
|||
|
|
Using the textfile command, you can instruct node-exporter to collect the `node_meta` metric.
|
|||
|
|
Now that you have a metric containing the Docker Swarm node ID and name, you can use it in promql queries.
|
|||
|
|
|
|||
|
|
Let's say you want to find the available memory on each node, normally you would write something like this:
|
|||
|
|
|
|||
|
|
```
|
|||
|
|
sum(node_memory_MemAvailable) by (instance)
|
|||
|
|
|
|||
|
|
{instance="10.0.0.5:9100"} 889450496
|
|||
|
|
{instance="10.0.0.13:9100"} 1404162048
|
|||
|
|
{instance="10.0.0.15:9100"} 1406574592
|
|||
|
|
```
|
|||
|
|
|
|||
|
|
The above result is not very helpful since you can't tell what Swarm node is behind the instance IP.
|
|||
|
|
So let's write that query taking into account the node_meta metric:
|
|||
|
|
|
|||
|
|
```sql
|
|||
|
|
sum(node_memory_MemAvailable * on(instance) group_left(node_id, node_name) node_meta) by (node_id, node_name)
|
|||
|
|
|
|||
|
|
{node_id="wrdvtftteo0uaekmdq4dxrn14",node_name="swarm-manager-1"} 889450496
|
|||
|
|
{node_id="moggm3uaq8tax9ptr1if89pi7",node_name="swarm-worker-1"} 1404162048
|
|||
|
|
{node_id="vkdfx99mm5u4xl2drqhnwtnsv",node_name="swarm-worker-2"} 1406574592
|
|||
|
|
```
|
|||
|
|
|
|||
|
|
This is much better. Instead of overlay IPs, now I can see the actual Docker Swarm nodes ID and hostname. Knowing the hostname of your nodes is useful for alerting as well.
|
|||
|
|
|
|||
|
|
You can define an alert when available memory reaches 10%. You also will receive the hostname in the alert message
|
|||
|
|
and not some overlay IP that you can't correlate to a infrastructure item.
|
|||
|
|
|
|||
|
|
Maybe you are wondering why you need the node ID if you have the hostname. The node ID will help you match
|
|||
|
|
node-exporter instances to cAdvisor instances. All metrics exported by cAdvisor have a label named `container_label_com_docker_swarm_node_id`,
|
|||
|
|
and this label can be used to filter containers metrics by Swarm nodes.
|
|||
|
|
|
|||
|
|
Let's write a query to find out how many containers are running on a Swarm node.
|
|||
|
|
Knowing from the `node_meta` metric all the nodes IDs you can define a filter with them in Grafana.
|
|||
|
|
Assuming the filter is `$node_id` the container count query should look like this:
|
|||
|
|
|
|||
|
|
```
|
|||
|
|
count(rate(container_last_seen{container_label_com_docker_swarm_node_id=~"$node_id"}[5m]))
|
|||
|
|
```
|
|||
|
|
|
|||
|
|
Another use case for node ID is filtering the metrics provided by the Docker engine daemon.
|
|||
|
|
Docker engine doesn't have a label with the node ID attached on every metric, but there is a `swarm_node_info`
|
|||
|
|
metric that has this label. If you want to find out the number of failed health checks on a Swarm node
|
|||
|
|
you would write a query like this:
|
|||
|
|
|
|||
|
|
```
|
|||
|
|
sum(engine_daemon_health_checks_failed_total) * on(instance) group_left(node_id) swarm_node_info{node_id=~"$node_id"})
|
|||
|
|
```
|
|||
|
|
|
|||
|
|
For now the engine metrics are still experimental. If you want to use dockerd-exporter you have to enable
|
|||
|
|
the experimental feature and set the metrics address to `0.0.0.0:9323`.
|
|||
|
|
|
|||
|
|
If you are running Docker with systemd create or edit
|
|||
|
|
/etc/systemd/system/docker.service.d/docker.conf file like so:
|
|||
|
|
|
|||
|
|
```
|
|||
|
|
[Service]
|
|||
|
|
ExecStart=
|
|||
|
|
ExecStart=/usr/bin/dockerd \
|
|||
|
|
--storage-driver=overlay2 \
|
|||
|
|
--dns 8.8.4.4 --dns 8.8.8.8 \
|
|||
|
|
--experimental=true \
|
|||
|
|
--metrics-addr 0.0.0.0:9323
|
|||
|
|
```
|
|||
|
|
|
|||
|
|
Apply the config changes with `systemctl daemon-reload && systemctl restart docker` and
|
|||
|
|
check if the docker_gwbridge ip address is 172.18.0.1:
|
|||
|
|
|
|||
|
|
```bash
|
|||
|
|
ip -o addr show docker_gwbridge
|
|||
|
|
```
|
|||
|
|
|
|||
|
|
Replace 172.18.0.1 with your docker_gwbridge address in the compose file:
|
|||
|
|
|
|||
|
|
```yaml
|
|||
|
|
dockerd-exporter:
|
|||
|
|
image: stefanprodan/caddy
|
|||
|
|
environment:
|
|||
|
|
- DOCKER_GWBRIDGE_IP=172.18.0.1
|
|||
|
|
```
|
|||
|
|
|
|||
|
|
Collecting Docker Swarm metrics with Prometheus is not a smooth process, and
|
|||
|
|
because of `group_left` queries tend to become more complex.
|
|||
|
|
In the future I hope Swarm DNS will contain the SRV record for hostname and Docker engine
|
|||
|
|
metrics will expose container metrics replacing cAdvisor all together.
|
|||
|
|
|
|||
|
|
## Configure Prometheus
|
|||
|
|
|
|||
|
|
I've set the Prometheus retention period to 24h, you can change these values in the
|
|||
|
|
compose file or using the env variable `PROMETHEUS_RETENTION`.
|
|||
|
|
|
|||
|
|
```yaml
|
|||
|
|
prometheus:
|
|||
|
|
image: stefanprodan/swarmprom-prometheus
|
|||
|
|
command:
|
|||
|
|
- '-storage.tsdb.retention=24h'
|
|||
|
|
deploy:
|
|||
|
|
resources:
|
|||
|
|
limits:
|
|||
|
|
memory: 2048M
|
|||
|
|
reservations:
|
|||
|
|
memory: 1024M
|
|||
|
|
```
|
|||
|
|
|
|||
|
|
When using host volumes you should ensure that Prometheus doesn't get scheduled on different nodes. You can
|
|||
|
|
pin the Prometheus service on a specific host with placement constraints.
|
|||
|
|
|
|||
|
|
```yaml
|
|||
|
|
prometheus:
|
|||
|
|
image: stefanprodan/swarmprom-prometheus
|
|||
|
|
volumes:
|
|||
|
|
- prometheus:/prometheus
|
|||
|
|
deploy:
|
|||
|
|
mode: replicated
|
|||
|
|
replicas: 1
|
|||
|
|
placement:
|
|||
|
|
constraints:
|
|||
|
|
- node.labels.monitoring.role == prometheus
|
|||
|
|
```
|
|||
|
|
|
|||
|
|
## Configure alerting
|
|||
|
|
|
|||
|
|
The Prometheus swarmprom comes with the following alert rules:
|
|||
|
|
|
|||
|
|
***Swarm Node CPU Usage***
|
|||
|
|
|
|||
|
|
Alerts when a node CPU usage goes over 80% for five minutes.
|
|||
|
|
|
|||
|
|
```
|
|||
|
|
ALERT node_cpu_usage
|
|||
|
|
IF 100 - (avg(irate(node_cpu{mode="idle"}[1m]) * on(instance) group_left(node_name) node_meta * 100) by (node_name)) > 80
|
|||
|
|
FOR 5m
|
|||
|
|
LABELS { severity="warning" }
|
|||
|
|
ANNOTATIONS {
|
|||
|
|
summary = "CPU alert for Swarm node '{{ $labels.node_name }}'",
|
|||
|
|
description = "Swarm node {{ $labels.node_name }} CPU usage is at {{ humanize $value}}%.",
|
|||
|
|
}
|
|||
|
|
```
|
|||
|
|
***Swarm Node Memory Alert***
|
|||
|
|
|
|||
|
|
Alerts when a node memory usage goes over 80% for five minutes.
|
|||
|
|
|
|||
|
|
```
|
|||
|
|
ALERT node_memory_usage
|
|||
|
|
IF sum(((node_memory_MemTotal - node_memory_MemAvailable) / node_memory_MemTotal) * on(instance) group_left(node_name) node_meta * 100) by (node_name) > 80
|
|||
|
|
FOR 5m
|
|||
|
|
LABELS { severity="warning" }
|
|||
|
|
ANNOTATIONS {
|
|||
|
|
summary = "Memory alert for Swarm node '{{ $labels.node_name }}'",
|
|||
|
|
description = "Swarm node {{ $labels.node_name }} memory usage is at {{ humanize $value}}%.",
|
|||
|
|
}
|
|||
|
|
```
|
|||
|
|
***Swarm Node Disk Alert***
|
|||
|
|
|
|||
|
|
Alerts when a node storage usage goes over 85% for five minutes.
|
|||
|
|
|
|||
|
|
```
|
|||
|
|
ALERT node_disk_usage
|
|||
|
|
IF ((node_filesystem_size{mountpoint="/rootfs"} - node_filesystem_free{mountpoint="/rootfs"}) * 100 / node_filesystem_size{mountpoint="/rootfs"}) * on(instance) group_left(node_name) node_meta > 85
|
|||
|
|
FOR 5m
|
|||
|
|
LABELS { severity="warning" }
|
|||
|
|
ANNOTATIONS {
|
|||
|
|
summary = "Disk alert for Swarm node '{{ $labels.node_name }}'",
|
|||
|
|
description = "Swarm node {{ $labels.node_name }} disk usage is at {{ humanize $value}}%.",
|
|||
|
|
}
|
|||
|
|
```
|
|||
|
|
|
|||
|
|
***Swarm Node Disk Fill Rate Alert***
|
|||
|
|
|
|||
|
|
Alerts when a node storage is going to remain out of free space in six hours.
|
|||
|
|
|
|||
|
|
```
|
|||
|
|
ALERT node_disk_fill_rate_6h
|
|||
|
|
IF predict_linear(node_filesystem_free{mountpoint="/rootfs"}[1h], 6*3600) * on(instance) group_left(node_name) node_meta < 0
|
|||
|
|
FOR 1h
|
|||
|
|
LABELS { severity="critical" }
|
|||
|
|
ANNOTATIONS {
|
|||
|
|
summary = "Disk fill alert for Swarm node '{{ $labels.node_name }}'",
|
|||
|
|
description = "Swarm node {{ $labels.node_name }} disk is going to fill up in 6h.",
|
|||
|
|
}
|
|||
|
|
```
|
|||
|
|
|
|||
|
|
You can add alerts to
|
|||
|
|
[swarm_node](https://github.com/stefanprodan/swarmprom/blob/master/prometheus/rules/swarm_node.rules)
|
|||
|
|
and [swarm_task](https://github.com/stefanprodan/swarmprom/blob/master/prometheus/rules/swarm_task.rules)
|
|||
|
|
files and rerun stack deploy to update them. Because these files are mounted inside the Prometheus
|
|||
|
|
container at run time as [Docker configs](https://docs.docker.com/engine/swarm/configs/)
|
|||
|
|
you don't have to bundle them with the image.
|
|||
|
|
|
|||
|
|
The Alertmanager swarmprom image is configured with the Slack receiver.
|
|||
|
|
In order to receive alerts on Slack you have to provide the Slack API url,
|
|||
|
|
username and channel via environment variables:
|
|||
|
|
|
|||
|
|
```yaml
|
|||
|
|
alertmanager:
|
|||
|
|
image: stefanprodan/swarmprom-alertmanager
|
|||
|
|
environment:
|
|||
|
|
- SLACK_URL=${SLACK_URL}
|
|||
|
|
- SLACK_CHANNEL=${SLACK_CHANNEL}
|
|||
|
|
- SLACK_USER=${SLACK_USER}
|
|||
|
|
```
|
|||
|
|
|
|||
|
|
You can install the `stress` package with apt and test out the CPU alert, you should receive something like this:
|
|||
|
|
|
|||
|
|

|
|||
|
|
|
|||
|
|
Cloudflare has made a great dashboard for managing alerts.
|
|||
|
|
Unsee can aggregate alerts from multiple Alertmanager instances, running either in HA mode or separate.
|
|||
|
|
You can access unsee at `http://<swarm-ip>:9094` using the admin user/password set via compose up:
|
|||
|
|
|
|||
|
|

|
|||
|
|
|
|||
|
|
## Monitoring applications and backend services
|
|||
|
|
|
|||
|
|
You can extend swarmprom with special-purpose exporters for services like MongoDB, PostgreSQL, Kafka,
|
|||
|
|
Redis and also instrument your own applications using the Prometheus client libraries.
|
|||
|
|
|
|||
|
|
In order to scrape other services you need to attach those to the `mon_net` network so Prometheus
|
|||
|
|
can reach them. Or you can attach the `mon_prometheus` service to the networks where your services are running.
|
|||
|
|
|
|||
|
|
Once your services are reachable by Prometheus you can add the dns name and port of those services to the
|
|||
|
|
Prometheus config using the `JOBS` environment variable:
|
|||
|
|
|
|||
|
|
```yaml
|
|||
|
|
prometheus:
|
|||
|
|
image: stefanprodan/swarmprom-prometheus
|
|||
|
|
environment:
|
|||
|
|
- JOBS=mongo-exporter:9216 kafka-exporter:9216 redis-exporter:9216
|
|||
|
|
```
|
|||
|
|
|
|||
|
|
## Monitoring production systems
|
|||
|
|
|
|||
|
|
The swarmprom project is meant as a starting point in developing your own monitoring solution. Before running this
|
|||
|
|
in production you should consider building and publishing your own Prometheus, node exporter and alert manager
|
|||
|
|
images. Docker Swarm doesn't play well with locally built images, the first step would be to setup a secure Docker
|
|||
|
|
registry that your Swarm has access to and push the images there. Your CI system should assign version tags to each
|
|||
|
|
image. Don't rely on the latest tag for continuous deployments, Prometheus will soon reach v2 and the data store
|
|||
|
|
will not be backwards compatible with v1.x.
|
|||
|
|
|
|||
|
|
Another thing you should consider is having redundancy for Prometheus and alert manager.
|
|||
|
|
You could run them as a service with two replicas pinned on different nodes, or even better,
|
|||
|
|
use a service like Weave Cloud Cortex to ship your metrics outside of your current setup.
|
|||
|
|
You can use Weave Cloud not only as a backup of your
|
|||
|
|
metrics database but you can also define alerts and use it as a data source for your Grafana dashboards.
|
|||
|
|
Having the alerting and monitoring system hosted on a different platform other than your production
|
|||
|
|
is good practice that will allow you to react quickly and efficiently when a major disaster strikes.
|
|||
|
|
|
|||
|
|
Swarmprom comes with built-in [Weave Cloud](https://www.weave.works/product/cloud/) integration,
|
|||
|
|
what you need to do is run the weave-compose stack with your Weave service token:
|
|||
|
|
|
|||
|
|
```bash
|
|||
|
|
TOKEN=<WEAVE-TOKEN> \
|
|||
|
|
ADMIN_USER=admin \
|
|||
|
|
ADMIN_PASSWORD=admin \
|
|||
|
|
docker stack deploy -c weave-compose.yml mon
|
|||
|
|
```
|
|||
|
|
|
|||
|
|
This will deploy Weave Scope and Prometheus with Weave Cortex as remote write.
|
|||
|
|
The local retention is set to 24h so even if your internet connection drops you'll not lose data
|
|||
|
|
as Prometheus will retry pushing data to Weave Cloud when the connection is up again.
|
|||
|
|
|
|||
|
|
You can define alerts and notifications routes in Weave Cloud in the same way you would do with alert manager.
|
|||
|
|
|
|||
|
|
To use Grafana with Weave Cloud you have to reconfigure the Prometheus data source like this:
|
|||
|
|
|
|||
|
|
* Name: Prometheus
|
|||
|
|
* Type: Prometheus
|
|||
|
|
* Url: https://cloud.weave.works/api/prom
|
|||
|
|
* Access: proxy
|
|||
|
|
* Basic auth: use your service token as password, the user value is ignored
|
|||
|
|
|
|||
|
|
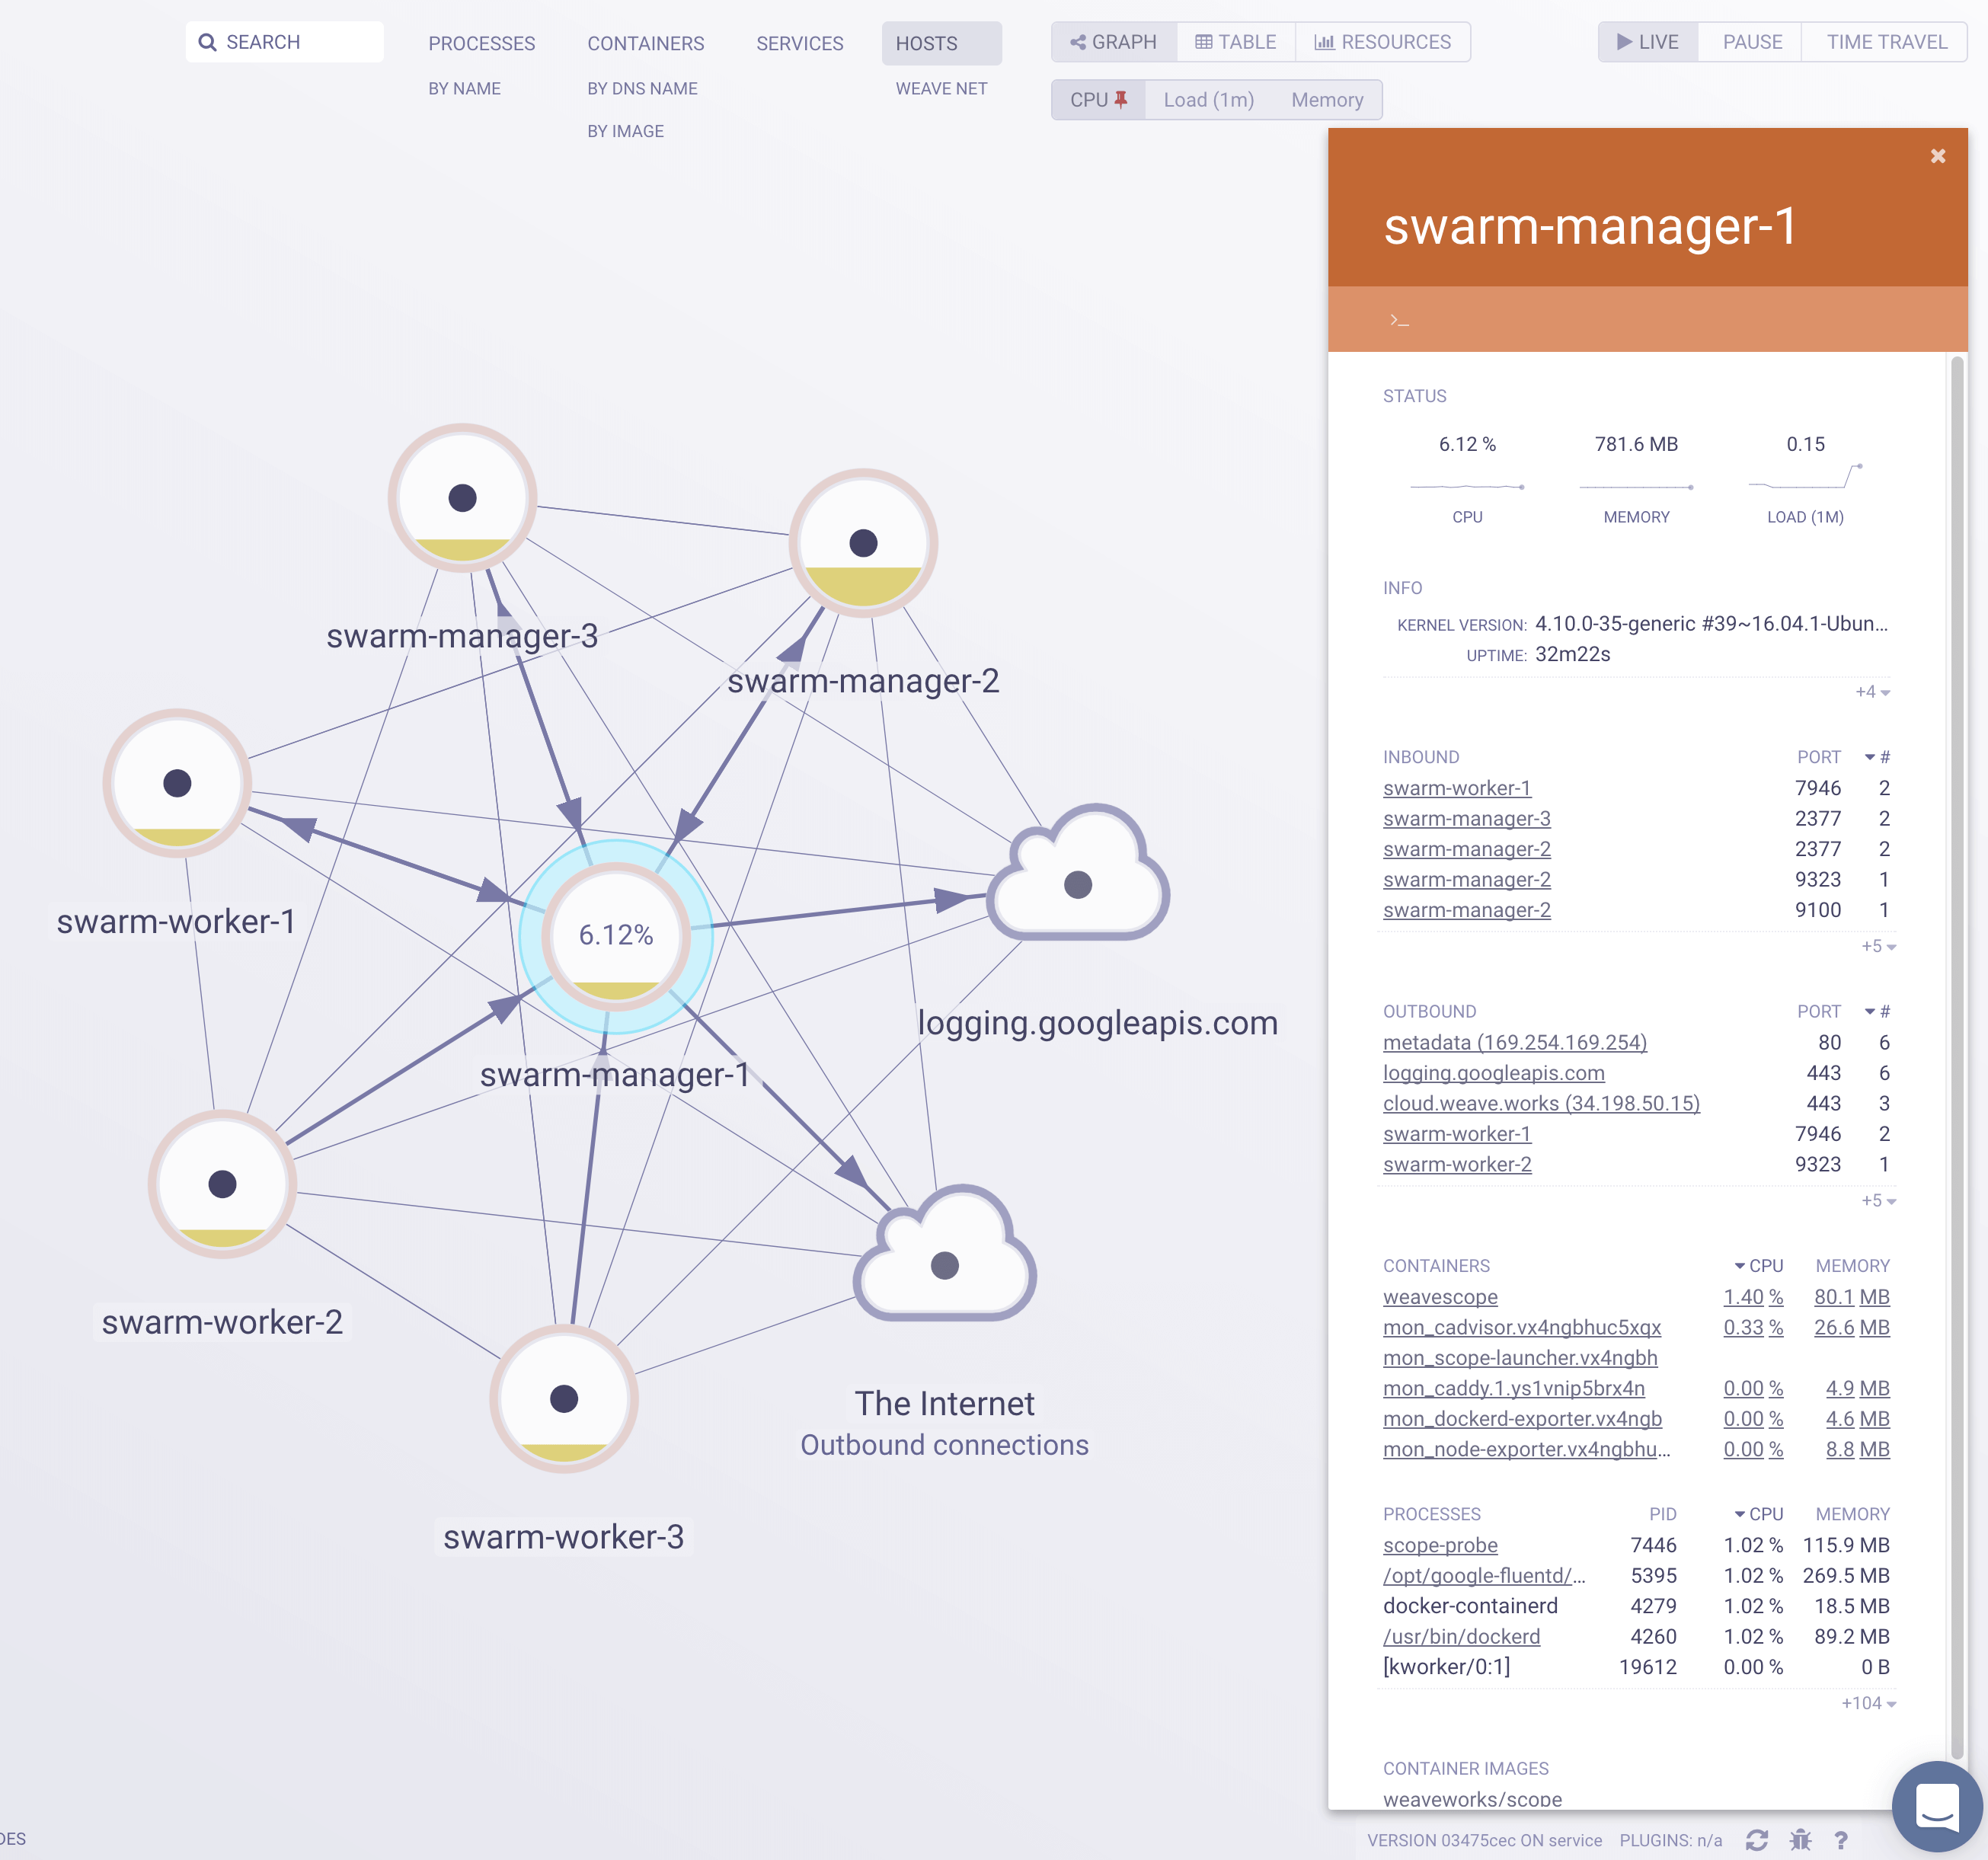
Weave Scope automatically generates a map of your application, enabling you to intuitively understand,
|
|||
|
|
monitor, and control your microservices based application.
|
|||
|
|
You can view metrics, tags and metadata of the running processes, containers and hosts.
|
|||
|
|
Scope offers remote access to the Swarm’s nods and containers, making it easy to diagnose issues in real-time.
|
|||
|
|
|
|||
|
|

|
|||
|
|
|
|||
|
|
|